
Income Inequality Grows in NYC Area
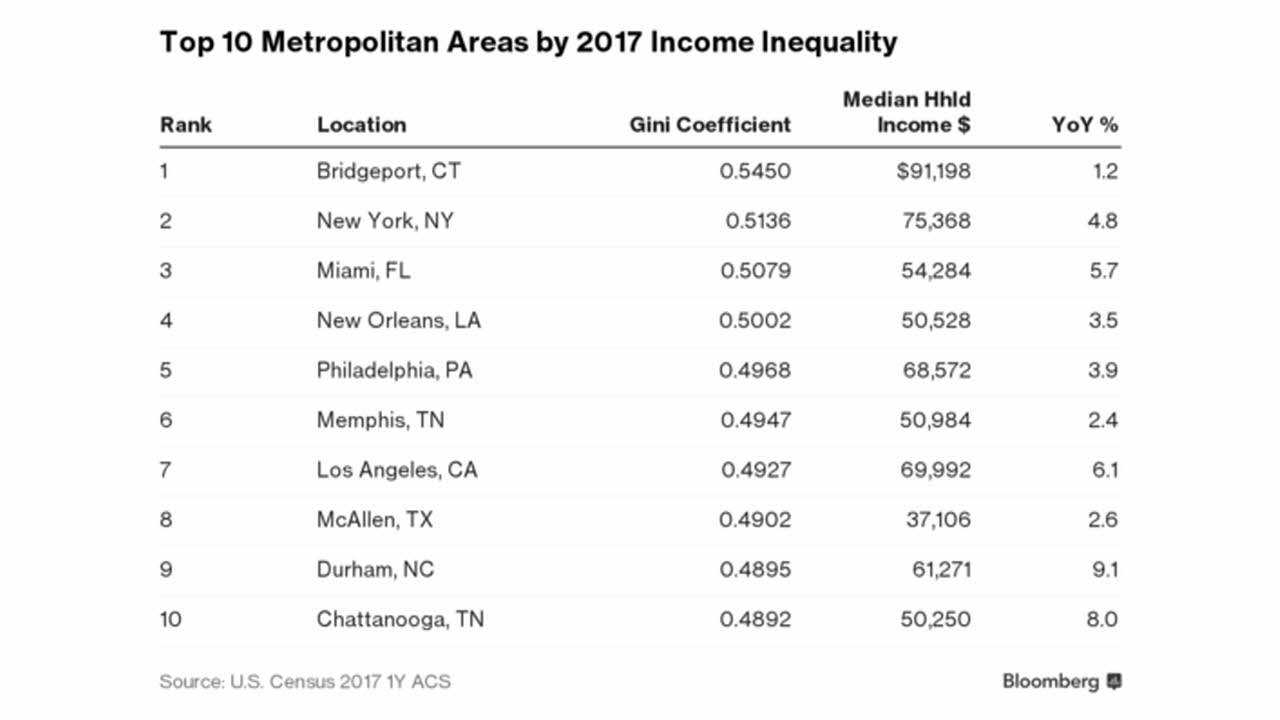
BLOOMBERGQUINT / BATTLE FOR WORLD – October 13, 2018: The article highlights that a ranking of 2017 income inequality among the 100 most populous U.S. metropolitan areas, as gauged by the Gini coefficient, shows New York taking to the number two spot from three, the prior year.
And the inequality increased in slightly more than 4 in 10 areas with the largest movements in Springfield, MA; El Paso, TX and Las Vegas, NV. The metro areas of New York and Miami switched positions, but still round-out the top three, as the most unequal metro areas after number one ranked Bridgeport-Stamford. Three Utah metro areas, Salt Lake City, Provo and Ogden are closest to income equality on the chart listed:
END
US income inequality continues to grow
CNBC / BATTLE FOR WORLD – (posted July 19, 2018) October 13, 2018: The article highlights that in 2015, the top 1 percent of families in the United States made more than 25 times what families in the bottom 99 percent did, according to a paper from the Economic Policy Institute.
This trend, which has picked up post Great Recession, is a reversal of what was seen during and after the Great Depression, where the gap between rich and poor narrowed, highlight the article.
And the “Rising inequality affects virtually every part of the country, not just large urban areas or financial centers,” said co-author Estelle Sommeiller.
Meanwhile, as the economic recovery continues, CEO pay has increased from about 20 times the typical worker’s pay to 271 times greater, from 1965 to 2016, according to 2017 a study by the EPI.
END